Ethereum is once again under pressure, struggling to hold above the $4,000 mark after a volatile rebound earlier this month. Investor sentiment across the crypto market remains mixed, with some analysts warning of a deeper pullback and others viewing the correction as a healthy reset before the next rally. The latest on-chain data adds another twist to this uncertainty, Ethereum’s exchange netflow has turned positive, signaling a potential shift in trader behavior.
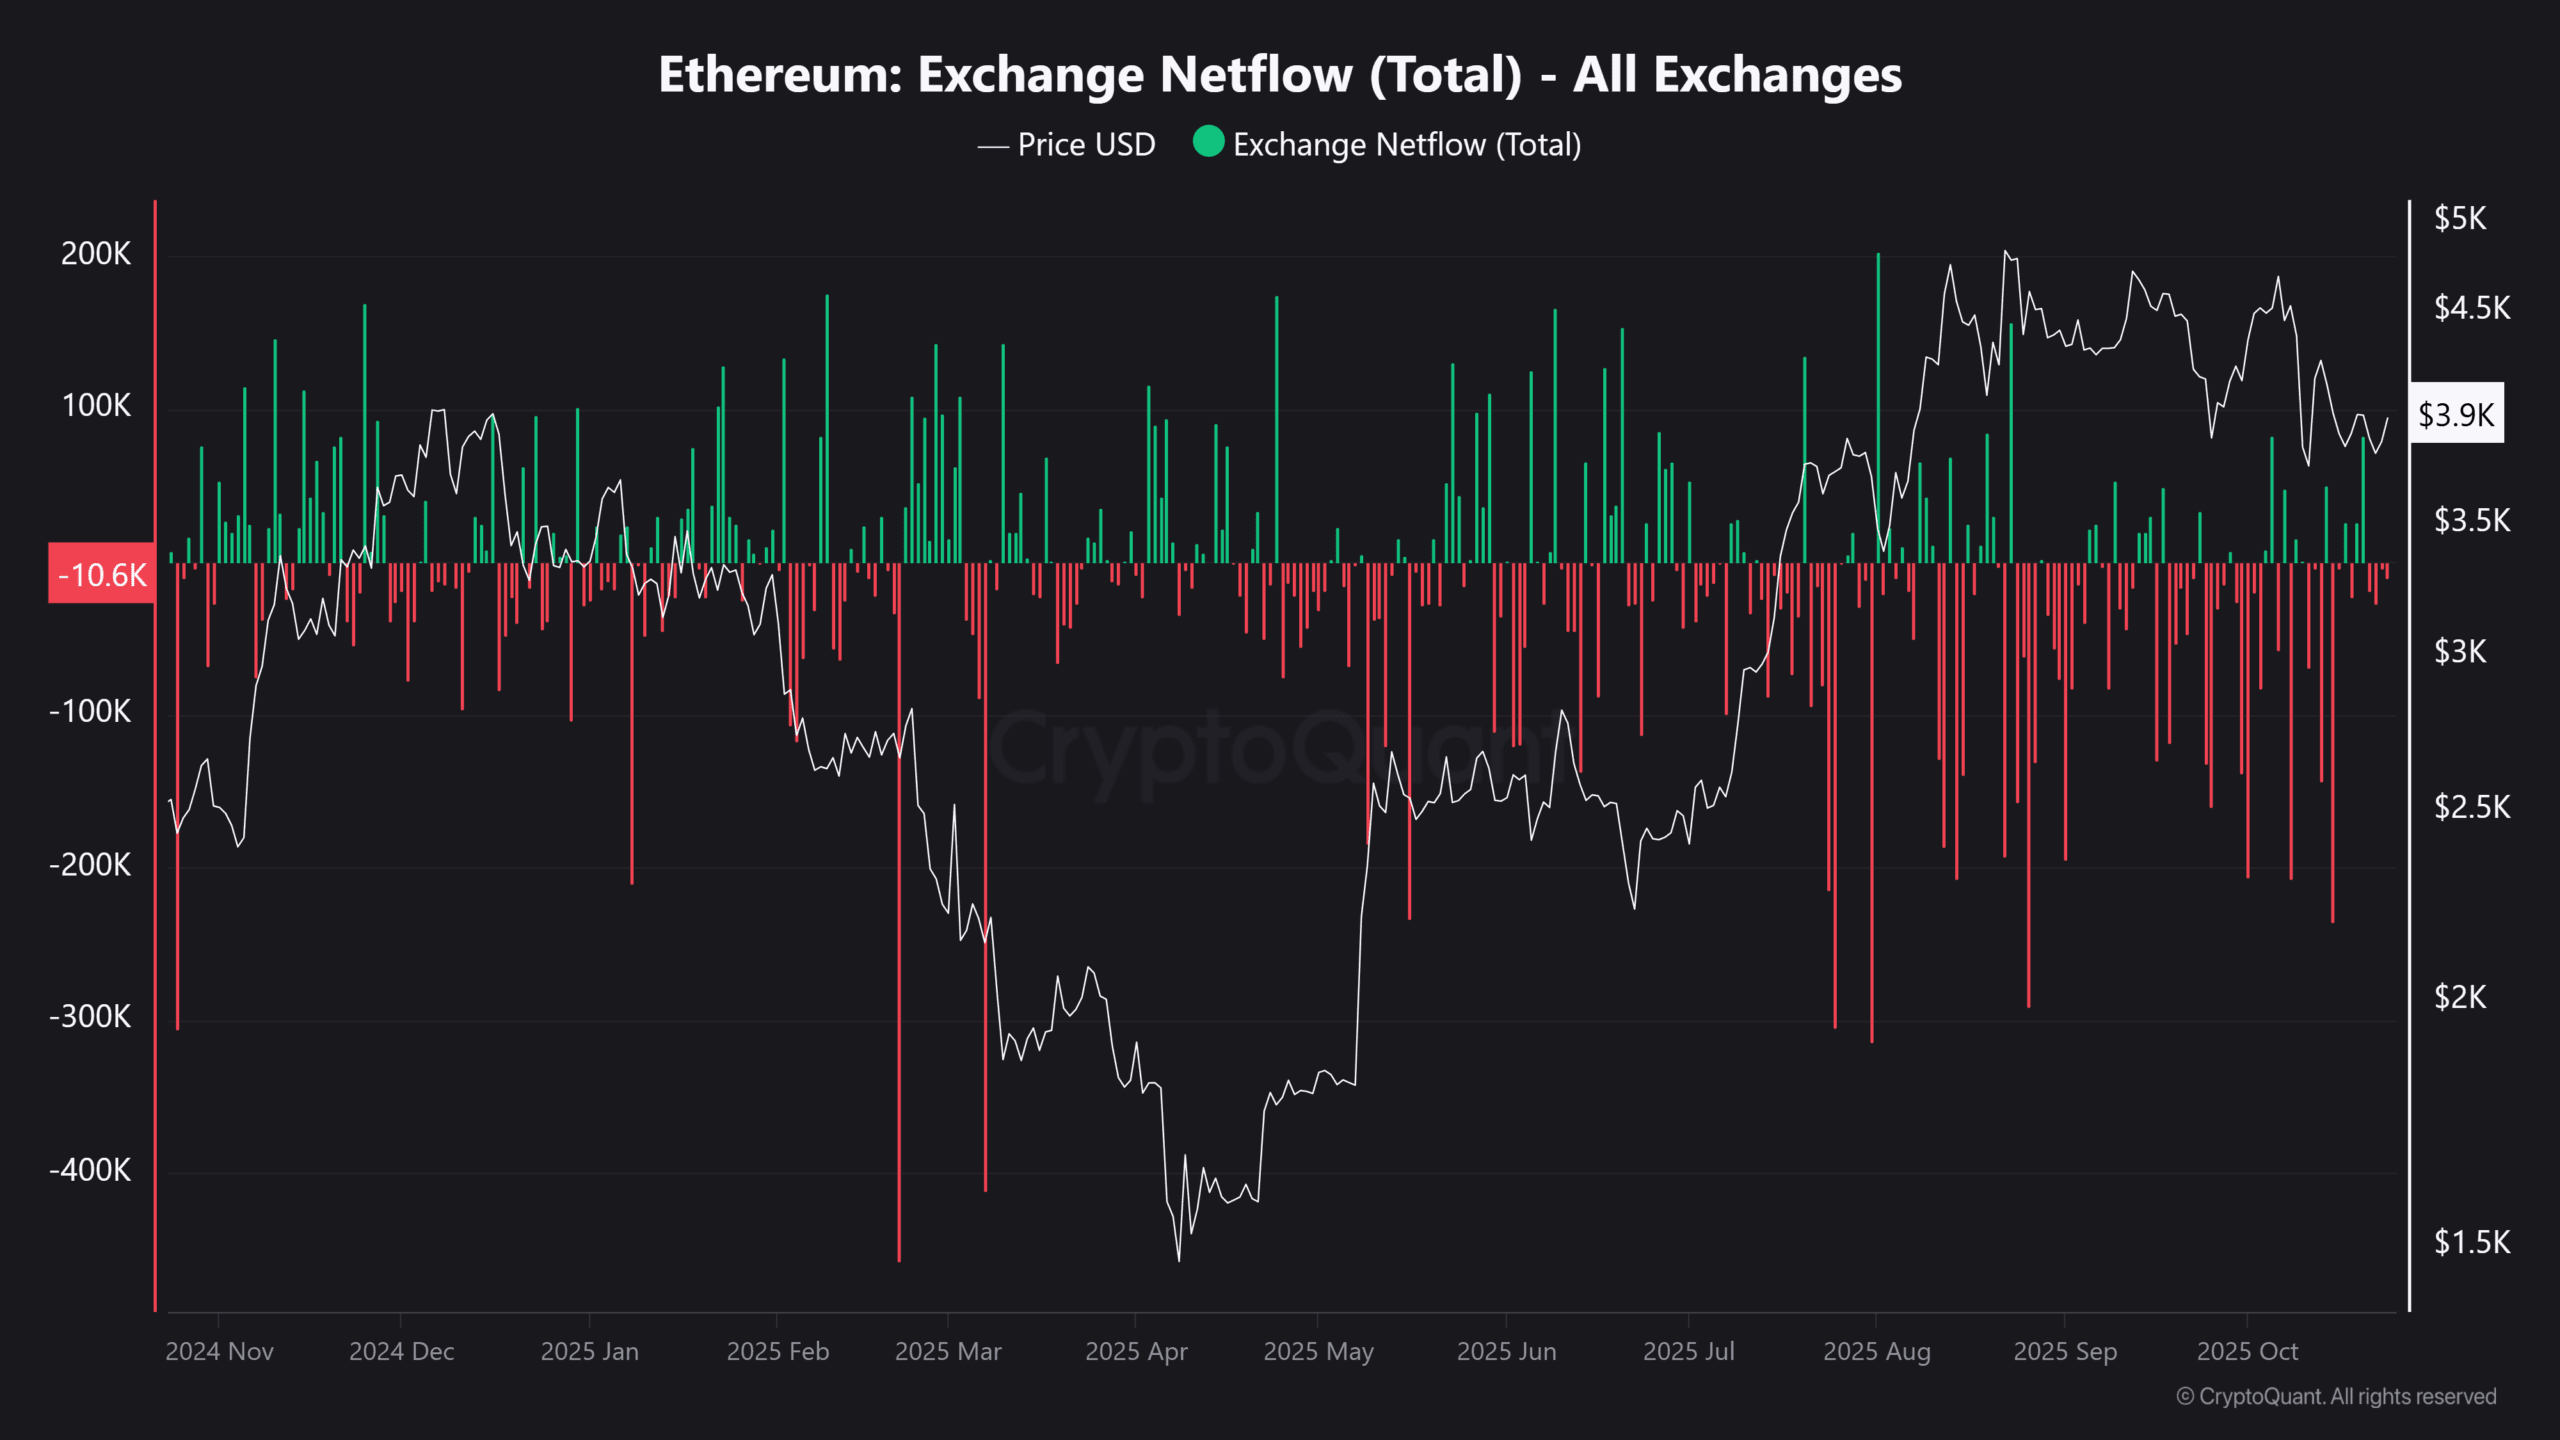
According to data from CryptoQuant, the seven-day moving average of Ethereum’s total exchange netflow has jumped from -57,000 ETH on October 16 to +7,000 ETH recently. This means more Ethereum is being transferred to exchanges than being withdrawn a pattern that often hints at rising selling pressure. When large holders or traders move coins to exchanges, it can suggest preparations to sell, hedge, or rebalance portfolios amid market volatility.

However, not every inflow signals panic selling. Some analysts believe the shift could reflect strategic positioning by whales or institutions. During uncertain market phases, traders often send ETH to exchanges as collateral for futures positions or to manage liquidity. The true impact depends on how long the inflows persist and whether they coincide with significant price movement.
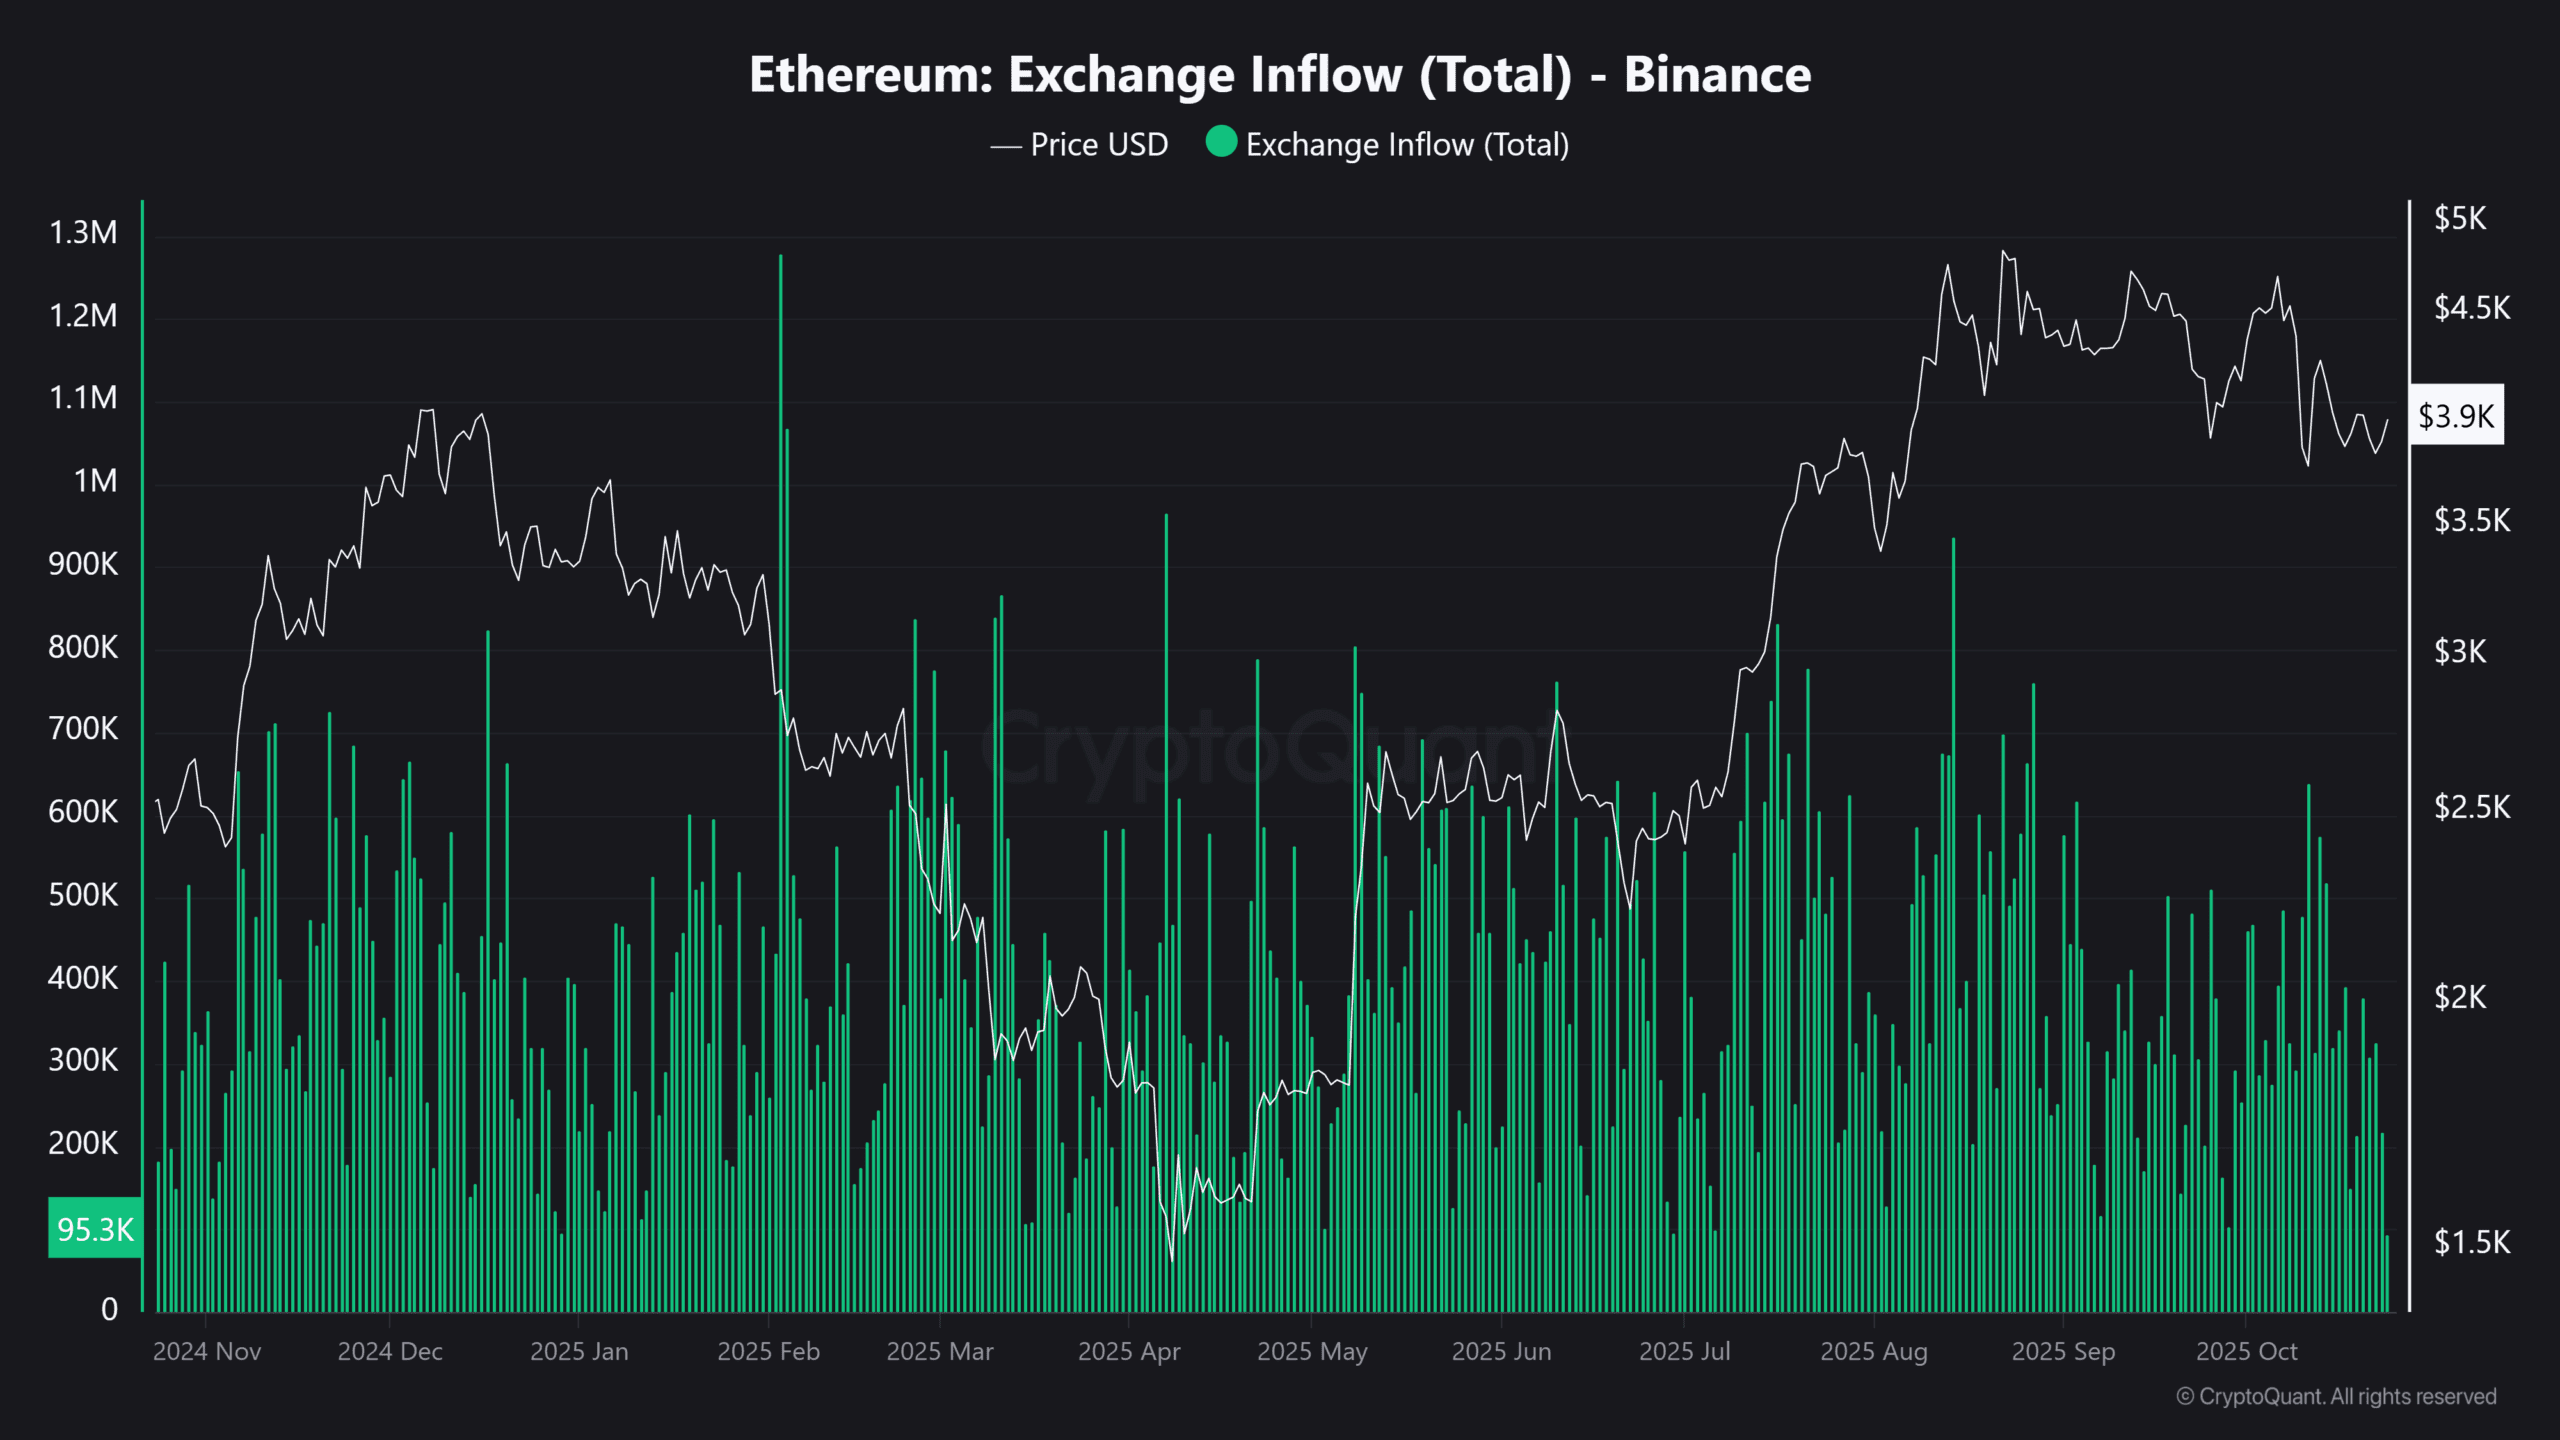
The data reveals that Binance is playing a major role in this trend. The exchange’s seven-day netflow shifted sharply from -31,000 ETH to +3,000 ETH in just a few days, accounting for nearly 50% of all ETH inflows across major platforms. This makes Binance the single largest contributor to Ethereum’s on-chain liquidity movement, reinforcing its influence over short-term price direction.
Historically, when Binance leads inflow activity during a weak market, it often reflects increased selling readiness or derivatives hedging. Traders typically use Binance for both spot and futures trading, so a rise in exchange balances could either precede sell-offs or mark a period of market restructuring.
The CoinDesk Ethereum Index remains up about 2% at $4,200, but the tone has turned cautious. Analysts say that if inflows continue at this pace while Ethereum fails to regain strength above $4,000, pressure could mount, pushing prices down toward $3,800 or even $3,700 in the short term.
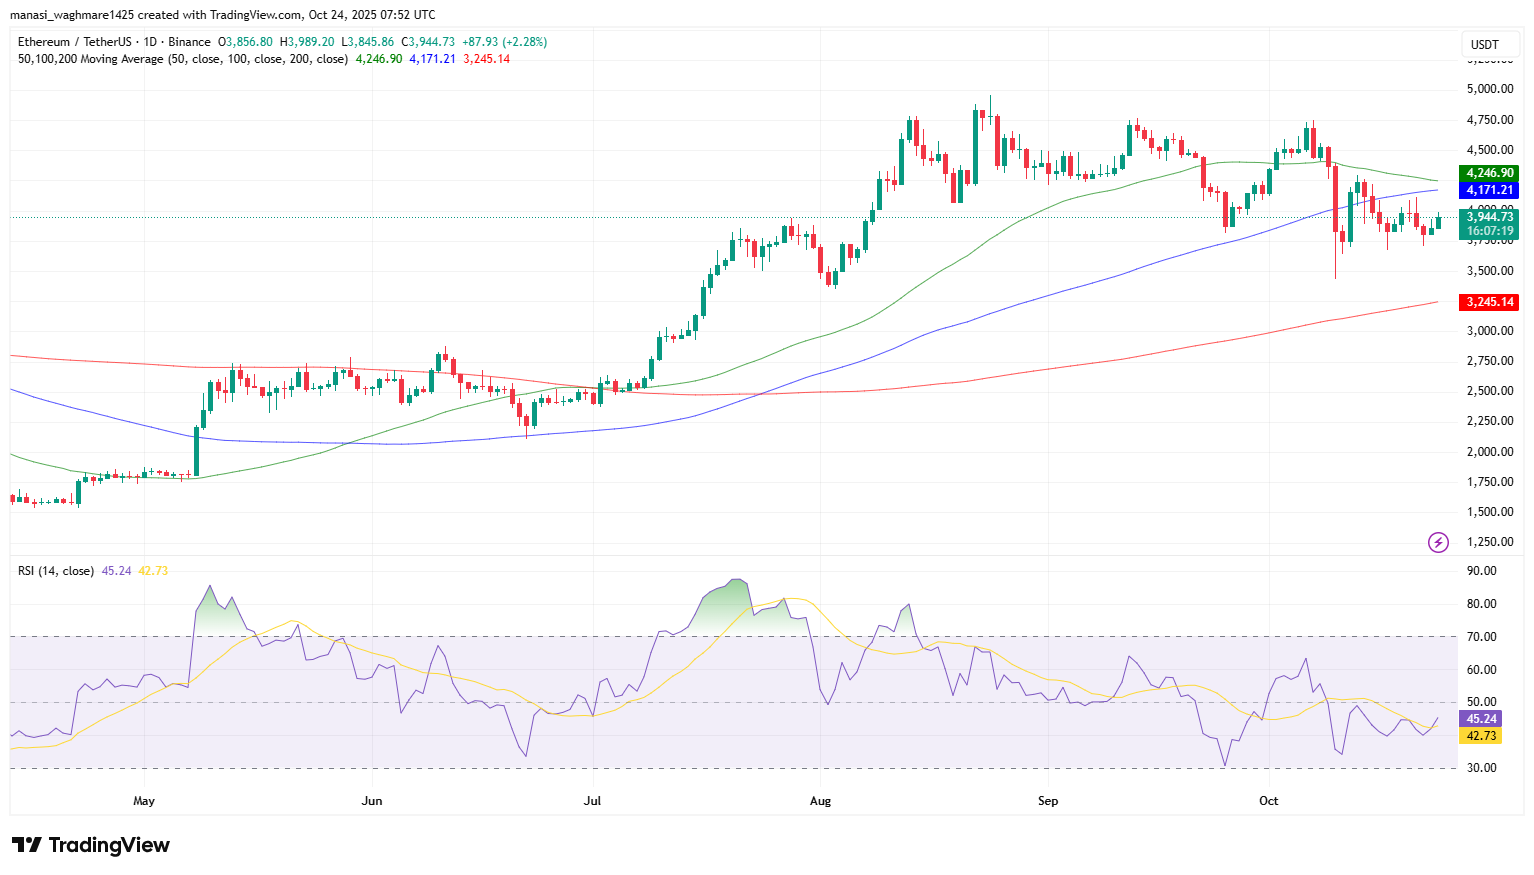
Ethereum is currently trading around $3,942, holding slightly above a critical short-term support zone between $3,700 and $3,750. On the technical chart, ETH has been consolidating near its 50-day moving average, which now acts as an important defense line for bulls. After failing to maintain momentum above $4,400 earlier in October, ETH entered a correction phase characterized by lower highs a typical pattern when buyers begin to lose strength. However, analysts note that as long as the price stays above the 100-day moving average near $3,400, Ethereum’s long-term uptrend remains intact.
| Level | Significance |
|---|---|
| $4,400 | Resistance — previous local top |
| $4,000–$4,200 | Key resistance zone to reclaim |
| $3,700–$3,750 | Short-term support area |
| $3,400 | Major support / 100-day MA |
| $3,000 | Historical demand zone |
If Ethereum manages to stabilize above $3,900 and inflows begin to ease, a push toward $4,200 could follow, signaling renewed market confidence. On the other hand, a decisive breakdown below $3,700 could accelerate selling and open the path toward $3,400, where long-term buyers may step in again.
The shift in exchange flows comes after a $19 billion liquidation wave earlier this month wiped out excessive leverage across the market. While this reset removed weak positions, it also left traders cautious about re-entering. Current market sentiment leans neutral, with many preferring to wait for confirmation before calling the next trend. Analysts suggest that the coming days will be critical. If the inflow spike fades and Ethereum rebounds above $4,000, it would likely confirm that the market has absorbed recent selling pressure. But if the inflows persist and price momentum weakens, Ethereum could be headed for another retest of the lower range.
Ethereum’s Road Ahead
Ethereum’s next move may set the tone for the broader altcoin market. A recovery above $4,200 could reignite optimism across DeFi and Layer-2 ecosystems, lifting total value locked (TVL) and restoring confidence in risk assets. However, if prices break below $3,700, traders may adopt a risk-off stance, rotating capital into Bitcoin or stablecoins until volatility cools.
For now, Ethereum stands at a crossroads balancing between caution and recovery. Whether this netflow flip becomes a warning sign or a setup for the next rally will depend on how traders interpret the data in the coming week.
Stay informed with daily updates from Blockchain Magazine on Google News. Click here to follow us and mark as favorite: [Blockchain Magazine on Google News].
Disclaimer: Any post shared by a third-party agency are sponsored and Blockchain Magazine has no views on any such posts. The views and opinions expressed in this post are those of the clients and do not necessarily reflect the official policy or position of Blockchain Magazine. The information provided in this post is for informational purposes only and should not be considered as financial, investment, or professional advice. Blockchain Magazine does not endorse or promote any specific products, services, or companies mentioned in this posts. Readers are encouraged to conduct their own research and consult with a qualified professional before making any financial decisions.

