Ethereum is once again at the center of crypto’s spotlight. Mid-October 2025 has brought the token to a tense moment, with its price hovering just above the $3,500 mark. For traders and long-term holders alike, this level is more than just another number on the chart. It has become the defining test that could dictate Ethereum’s short-term future. Holding above $3,500 could open the path to a $4,400 rally, but losing this support may send the asset sliding to $3,300 or lower.

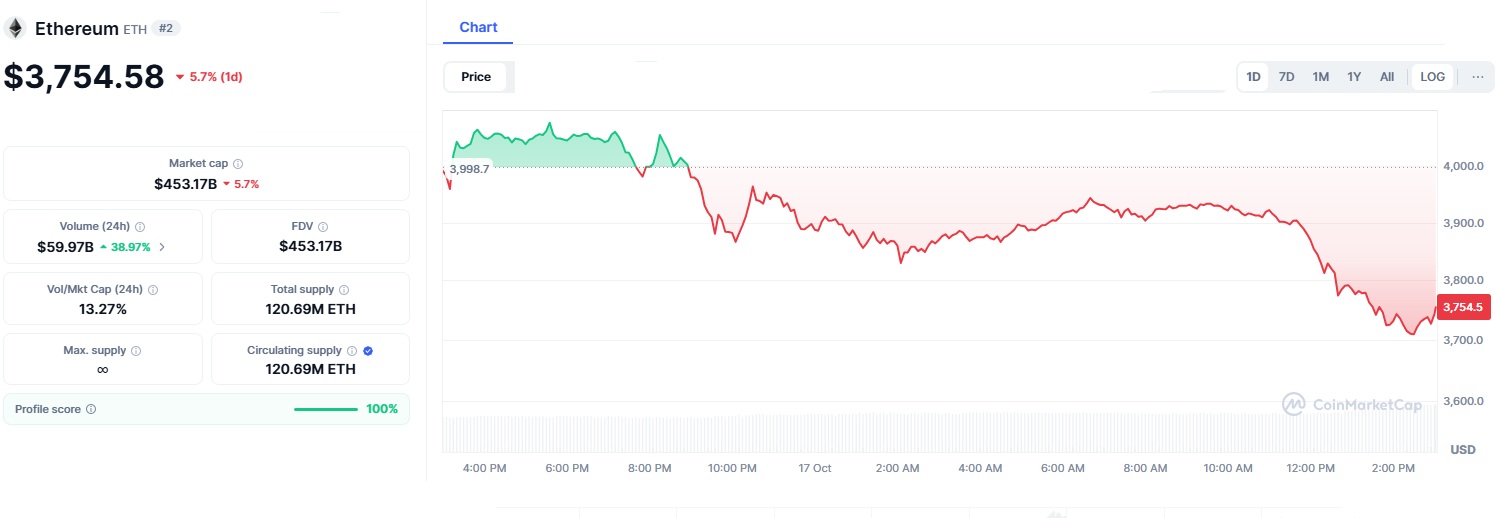
On October 16, 2025, Ethereum trades at $3,754, reflecting a 5.7 percent dip in the past 24 hours and a 13 percent decline over the past week. This follows $1.2 billion in ETF outflows in just a few days, a wave of selling that has unsettled investor confidence.
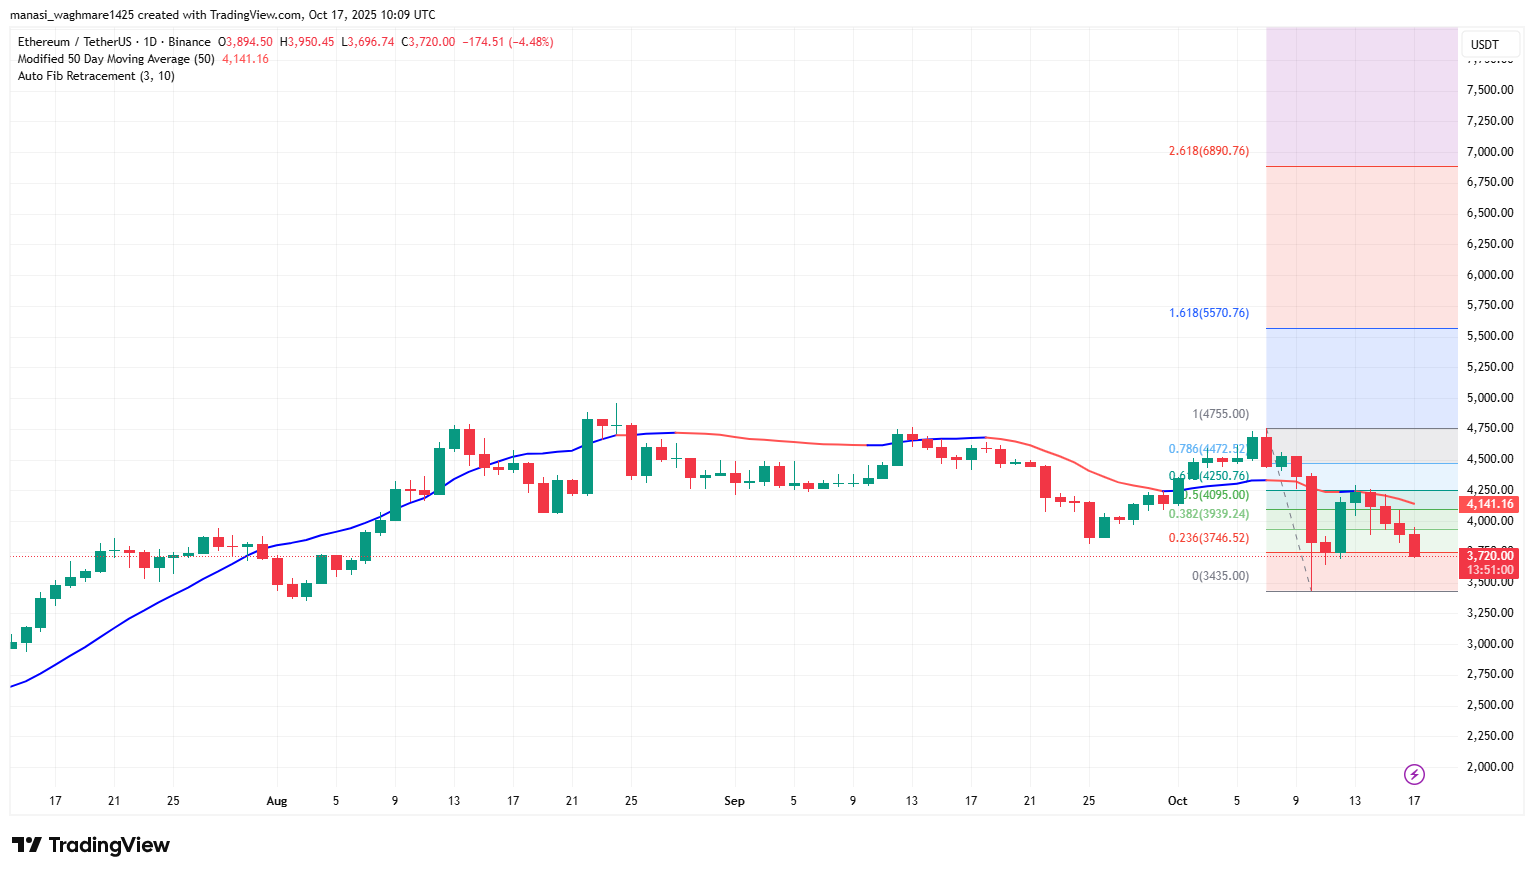
The $3,500 region is not chosen at random. It combines several technical signals, including the 50-day Exponential Moving Average and the 0.618 Fibonacci retracement level, both of which are widely seen as reliable points of support. Since September, this zone has held strong, cushioning the token from deeper declines. A break below it, however, would expose Ethereum to its next major support around $2,300, aligned with the 200-week EMA and a prior market low.

On the other side of the spectrum, if buyers defend $3,500 successfully and push through $3,600 resistance, the door opens to $3,400. This potential upside is also supported by optimism around Ethereum’s upcoming Prague and Electra upgrades, designed to improve scalability and efficiency.
| Key Level | Support or Resistance | Indicator |
|---|---|---|
| $3,500 | Critical Support | 50-day EMA, |
| $3,300 | Immediate Resistance | Short-term ceiling |
| $3,600 | Next Support if Broken | 200-week EMA, prior low |
| $3,900 | Target if Breaks Higher | Resistance zone |
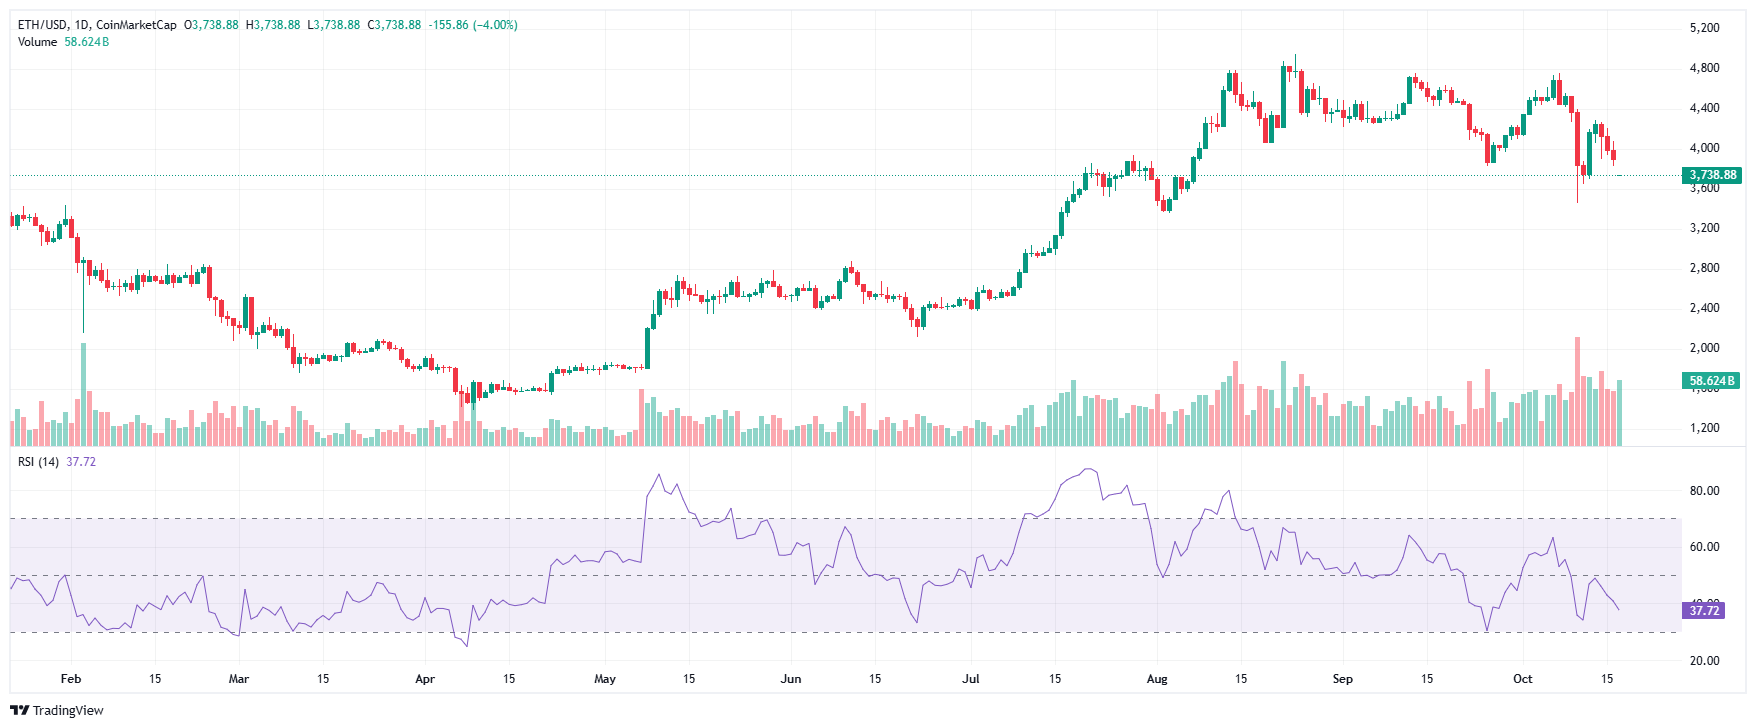
Ethereum’s chart is sending mixed signals. The Relative Strength Index sits at 37, suggesting the token is close to oversold territory, which often indicates the possibility of a bounce. Trading volume, at $60 billion in 24 hours, shows that interest in the token remains high, a factor that can fuel volatility in either direction.

On the downside, the MACD indicator has turned bearish with a cross to the negative side, warning that momentum may favor sellers. This conflict between potential for recovery and signs of weakening demand is why traders are watching the charts so closely.
Bulls vs. Bears
Public commentary reflects the divide. Supporters argue that the $2,500 level represents a fortress, reinforced by the confluence of moving averages and Fibonacci retracement. For them, ETF outflows are temporary noise, and Ethereum’s upgrades could become the catalyst for a sharp rebound. Some community voices see $3,400 as a realistic near-term target, provided support holds.
Skeptics counter with warnings about the MACD cross and sustained ETF outflows, both of which point to declining confidence among larger investors. For this camp, a fall to $3,300 is not just possible but likely if buying power fails to materialize. Online forums, trading channels, and video streams capture the drama in real time, with bullish optimism clashing against cautious realism.
Ethereum’s performance rarely affects only its holders. Because ETH underpins much of the decentralized finance and NFT ecosystems, its price stability influences the confidence of an entire sector. A defense of $3,500 could revive total value locked in DeFi platforms and improve sentiment across altcoins. A breakdown toward $3,300, however, would ripple through smaller tokens, creating wider losses and fueling risk-off sentiment across crypto markets.
Institutions are also paying close attention. The heavy ETF outflows show hesitation, but they also create opportunities for long-term accumulation if prices stabilize. Developers, meanwhile, focus less on short-term swings and more on the upcoming Prague and Electra upgrades, which could strengthen Ethereum’s utility regardless of immediate price action.
What Comes Next for ETH?
The near future for Ethereum rests on two critical thresholds. Defending $3,500 and flipping $3,600 into support would give bulls momentum to target $4,400 in the coming weeks. Failing that, the asset risks cascading toward $3,300, where long-term moving averages provide the next cushion.
Looking further ahead, the outcome of this test may influence Ethereum’s trajectory into 2026. Optimists see the possibility of the token climbing past $5,000 if upgrades deliver on their promises and institutional inflows return. Pessimists warn that repeated failures to hold key supports could drag Ethereum closer to $2,000, a level that would test the resolve of even its strongest backers.
Ethereum’s current standoff at $3,500 is more than a technical marker. It is a moment that blends investor psychology, institutional behavior, and the evolution of blockchain technology itself. Bulls view it as the gateway to a $4,400 rally, while bears warn of a plunge to $3,300 if selling pressure persists.
The next few weeks will decide whether Ethereum writes this chapter as a story of resilience or retreat. Whatever the outcome, this moment underscores the token’s role as the bellwether of a maturing crypto market one where upgrades, regulation, and sentiment converge to shape the path ahead.
Stay informed with daily updates from Blockchain Magazine on Google News. Click here to follow us and mark as favorite: [Blockchain Magazine on Google News].
Disclaimer: Any post shared by a third-party agency are sponsored and Blockchain Magazine has no views on any such posts. The views and opinions expressed in this post are those of the clients and do not necessarily reflect the official policy or position of Blockchain Magazine. The information provided in this post is for informational purposes only and should not be considered as financial, investment, or professional advice. Blockchain Magazine does not endorse or promote any specific products, services, or companies mentioned in this posts. Readers are encouraged to conduct their own research and consult with a qualified professional before making any financial decisions.