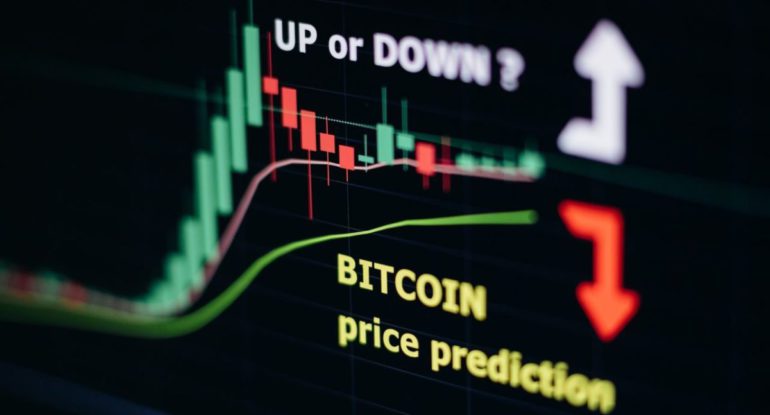
Understanding The Crypto Market Amidst All High And Low

Understanding a variety of tools is necessary for crypto. These tools can help you comprehensively view the market’s state and make precise predictions. You should be aware that the crypto market is highly volatile; therefore, learning to perform technical analysis on cryptocurrencies is necessary if you want to proceed successfully.
It might not difficult to keep up with all the graphs, charts, and information regarding various cryptocurrencies published in the crypto market. Nevertheless, the entire cryptosystem will become more apparent as you learn about technical analysis in the world of cryptocurrencies and how the market functions. This article includes many online price charts, projections, and market predictions for different cryptocurrencies. Before we delve into the field of crypto technical analysis, let’s clarify what the term “technical analysis” means.
What is technical analysis in cryptocurrency?
Cryptocurrency analysts plot real-world data to forecast future outcomes from the crypto market or other essential sources. Based on this information, you can predict whether the market will rise or decline. As a result, you will be able to buy when the market is undervalued and sell when the market is overvalued.
To perfect the skill of “analyzing,” one must practice, make mistakes, and keep trying until one succeeds. Numerous authors have discussed the best technique for researching the crypto market and achieving fantastic results. You must comprehend the elements seen on a price chart and know how they affect the price to be a successful trader.
How does a crypto candlestick operate, and what is it?
One of the first technical analyses you can encounter on a price chart when researching the crypto market as a writer is the candlestick. This describes things with a rectangle shape on a price chart (either green or red).
The opening and closing balances of a coin are displayed in a rectangle. A candlestick will show the amount of price change after 24 hours of searching for coin prices. By observing the color of the candlestick, it is possible to determine if a stock is making or losing money.
A quick revision guide to brush up on candlestick basics 👇https://t.co/uaIxs1uCmZ
— WazirX: India Ka Bitcoin Exchange (@WazirXIndia) August 12, 2022
Moveable Averages
To forecast a coin’s price chart movement, more data is needed than only sales volume and candlestick trend. Considering price changes over a lengthy period, such as days or weeks, is crucial. It’s critical to be able to judge when to buy or sell. We are examining the moving average in this situation. An EMA or a simple moving average (SMA) can be used to analyze a price chart (exponentially weighted moving average). Most people think it’s an excellent indicator of how the moving average will behave in the future.
Exponential Moving Average (EMA)
The EMA is more sophisticated than the SMA, despite the SMA being easier to use. The EMA does not give the closing balance of each day to the SMA equally, using seven days as an example. It considers how comparable the price on one day is to that on another. The days before are therefore given more importance than the days after. As a result, it is more sensitive to the crypto market’s volatility, which is advantageous given its waning importance.
The moving average might help understand the technical analysis of cryptocurrencies. For instance, it shows the opposition to selling or buying at a special price. Resistance develops when the closing price falls short of the moving average because more people are selling. If the moving average is broken, signaling a bullish market, selling should be considered.
Examining the pattern
Now that you have the necessary information, you are ready to look at the coin’s price chart. By accurately assessing the trend, you should be able to decide when to buy and sell (to make a profit) (on the bottom). The information in this post will put you on the right track if you’re a cryptocurrency beginner trying to comprehend the fundamentals.
Also, read – Top 10 Crypto Compliance Jobs In The Crypto Market
Conclusion
Before making a bitcoin investment, investors might want more information than technical analysis. Technical analysis of cryptocurrencies may still be highly subjective, even though the signs are based on mathematics. It’s crucial to keep track that no technical indicator is 100 percent correct. Even though all signs point the same way, prices could behave differently than expected. The best a trader can hope for is a rise in the probability of making a wise decision.


