What Makes Ethereum an Attractive Investment

The cryptocurrency market was initially seen as a social phenomenon that would eventually lose shine. However, it has flourished over the past decade, expanding from investments to business transactions. Its promise to create a decentralized financial system beyond the control of banks and governments has captured our attention. And one of the leading cryptocurrencies is Ethereum (ETH-USD).
In 2021, the price of a single Ethereum broke $2,000 for the first time since its inception. And the value of the cryptocurrency market hit a staggering $2.5T. ETH continued to increase and set its all-time high at $4,878.26 in November 2021 before plunging in 2022.
Questions regarding their volatility have always surrounded ETH and all the other cryptocurrencies. But in the past two years, price swings have become more predictable. Their sensitivity to macroeconomic changes has become more evident. That is why investors are starting to doubt the reliability of cryptocurrencies as an inflation hedge.
Nevertheless, the returns have been much higher than stocks, making them more attractive. Hence, this article will discuss ETH and assess whether or not it is an attractive investment.
Why Ethereum Is Worth the Risk
ETH has been one of the leading cryptocurrencies over the years. And its bullish trend is expected to continue as the bull market heats up. It has much catching up to do, given its underperformance in the fourth quarter of 2023. These are the potential drivers of its uptrend.
Lower inflation may give upside potential to Ethereum
The crypto market has always been seen as a potential inflation hedge. Its very high volatility could hardly be connected to macroeconomic changes. Over the past decade, price swings in the cryptocurrency market have been driven purely by market sentiments. But things have changed in the past two years, as shown by the inverse relationship between inflation and Ethereum.
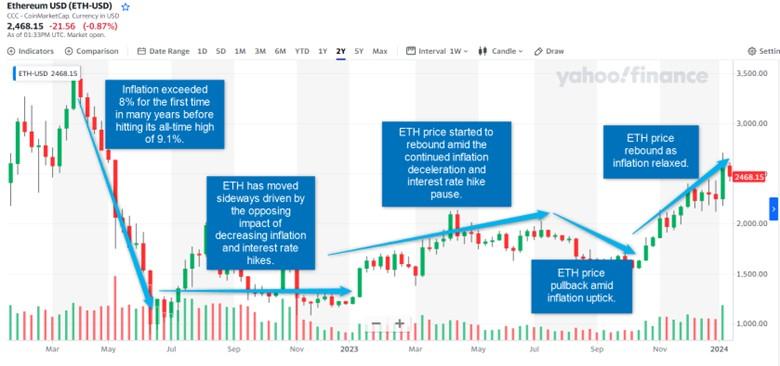
In the chart below, we can see how the price of Ethereum has moved in line with inflation in the past two years.

Image Source: Yahoo Finance
They have an evident inverse correlation. In fact, it started to materialize as early as the first half of 2021. ETH price increases began to slow down when inflation started to accelerate. When it exceeded 7% for the first time in many years, ETH started to decrease.
It became more evident in the first quarter of 2022 when inflation surpassed 8%. That’s when the downtrend became steeper, leading to a sudden crash. When inflation peaked in the second quarter of the same year, ETH hit its lowest point, reaching $1,000.
The following months were stable for ETH as inflation started decelerating. However, the series of interest rate hikes prevented it from rebounding. But it began to recover in the first quarter of 2023 as inflation decelerated and the Fed paused rate hikes.
It had a pullback in the third quarter amid the inflation uptick. But since the fourth quarter of last year, the price uptrend resumed as inflation became stable.
To prove our point, we can derive the correlation by their Multiple R, the correlation efficient. The value of 64.4% shows a strong correlation between the two.
Even better, this may also show a higher predictability of ETH. Although its potential as an inflation hedge has somewhat decreased, it may be easier to forecast its future trend. In addition, their inverse relationship indicates that ETH will keep increasing as inflation increases.
As of the recent report, inflation rose to 3.4%, but it stayed reasonable, given the holiday spending splurge. But once consumption normalizes again, inflation will keep decreasing again. In turn, the ETH price may sustain its increase. It is possible this year as inflation becomes more relaxed, and the Fed plans to make a rate cut in the second half.
High returns
The cryptocurrency market has been notorious for its high volatility, making it risky. Yet, the volatility in the market appears to be a double-edged sword that lets traders gain from sharp price increases. Ethereum has shown a similar trend, given its evident crests and troughs.
Most importantly, its general trend has been bullish over the years. Indeed, its sharp uptrend makes ETH trading viable.
If we compare Ethereum to stock price indices, we can see how it outperformed the stock market.
| Ethereum (ETH) | S&P 500 (SPX) | NASDAQ Composite (IXIC) | |
| Average Annual Returns | 47.00% | 12.12% | 16.08% |
| Risk-Free Rate | 3.99% | 3.99% | 3.99% |
| Standard Deviation | 88.48% | 17.95% | 24.00% |
| Sharpe Ratio | 0.49 | 0.43 | 0.47 |
ETH returns are higher than the main stock indices in the US market. It was about six times their average annual returns. The downside is the notable volatility of ETH, which was also about six times higher than the SPX. But if we match the risks and returns of the three using the Sharpe Ratio, ETH will still be the optimal choice.
We can also refer to the Treynor Ratio and Jensen’s Alpha to confirm the results further. We used the average annual returns of Bitcoin (BTC-USD) and other primary Altcoins to do this. This will be the reference value for ETH, SPX, and IXIC. ETH and SPX have betas of 0.78 and 0.72, respectively.
The direction of their price returns or simply the slope is similar to the trajectory of the reference value of BTC and other Altcoins. On the other hand, IXIC only has a beta of 0.04. Given this, we can also derive their Jensen’s Alpha.
| Ethereum (ETH) | S&P 500 (SPX) | NASDAQ Composite (IXIC) | |
| Average Annual Returns | 47.00% | 12.12% | 16.08% |
| Risk-Free Rate | 3.99% | 3.99% | 3.99% |
| Beta | 0.78 | 0.72 | 0.04 |
| Jensen’s Alpha | 0.92 | 0.43 | 0.14 |
Jensen’s Alpha of 0.98 shows that Ethereum has slightly underperformed relative to the crypto market average. This value is much larger than SPX with 0.43 and IXIC with 0.14.
Expanding coverage
For many years, ETH has been solely used for investments. But recently, ETH has increased its business and public sector exposure. ETH contracts are so popular today that even some government agencies in the Asia Pacific use them as payments for their services.
ETH is also used in many crowdfunding groups like DAOs. And now, many small businesses are becoming more open to accepting other cryptocurrencies besides Bitcoin. This acceptance can capture a higher demand for ETH holdings. And given the decreasing deployment of ETH contracts, the higher demand may also add upward pressure on the price.
Even better, the fact that ETH is built with blockchain technology means it can run programs on its network. This token has other purposes besides trading and payment means in the financial sector. It has attestation services, so users may cryptographically prove their credit score without showing their actual score. This service can help them apply for home loans in banks and other lending institutions. Hence, it can expand some more and capture new potential holders.
Recent underperformance
Ethereum has a Jensen’s Alpha of 0.98, showing its underperformance relative to the market. But much of it was noticed in the past year. Its trend is consistent with the market while keeping volatility relatively manageable. However, returns are below the market average.
Even so, its uptrend remains evident. Also, its recent underperformance means it is relatively cheaper than Bitcoin and many other Altcoins. Although it still has to catch up with the market, it has more room to speed up its increase. It is highly possible since the crypto market is starting to heat up. Additionally, its inverse relationship with inflation may drive its price increase.
Valuation
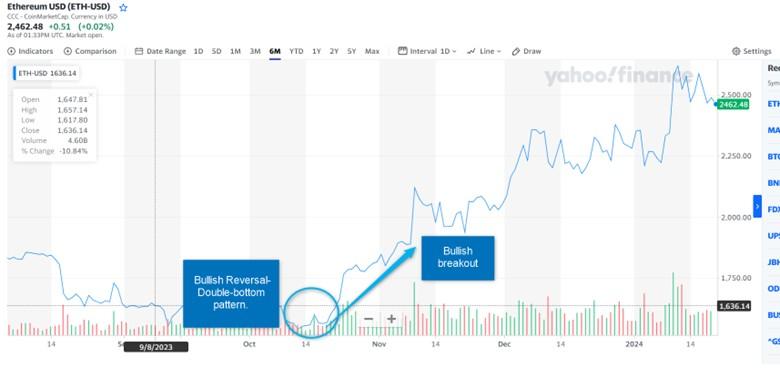
As ETH started to bounce back, a bullish breakout was immediately seen using the double-bottom pattern from the first low of $1,540 to $1,566. The pattern happened again when the price dipped to $1,773 before rebounding and dipping again to $1,789.
This proved the bullish breakout of ETH. We set our resistance level at $2,200, and it was surpassed in December. We tested it again at $2,600 as the momentum continued.

Image Source: Yahoo Finance
There were some dips that the recent events in the crypto market may have driven. Inflation expectations may have also contributed to it. But after moving sideways and testing the $2,200 resistance level, it went up again and exceeded our new resistance level.
The uptrend may continue as ETH catches up with the market and macroeconomic indicators become more stable. We are setting our support level at $2,200-2,250 for the bullish trend to persist. At $2,466, we keep our resistance level within $2,650-2,700. If the price dips below $2,200, it may indicate a bull trap.
Nonetheless, we’re optimistic about its uptrend, which may also be driven by better external factors and the heating up of the market. It is logical since the inverse relationship between inflation and Ethereum remains noticeable.
Key Takeaways
Ethereum remains one of the leading cryptocurrencies despite its slight underperformance in the past few months. But it opens more avenues for its sustained uptrend as it remains relatively cheaper than many other cryptocurrencies.
So, traders must watch new macroeconomic changes closely, given the influence of inflation on the ETH price. ETH remains an attractive investment, given its high returns, reasonable valuation, and the capacity of the price to increase more.


